Market research arithmetic · Inquoria
Calculate segment scores, source mismatches, and market size from supplied records.
Provide segment growth, margin, and risk values, a target source definition, and customer-count and spend inputs. Inquoria returns calculations with the supplied source IDs retained.
Sign in and you go straight back to the Inquoria conversation. Work happens in chat. This page never asks for your card details or email address.
Three calculations. The numbers stay the ones you typed.
Source mismatch checks use the supplied target year, region, and metric. Market size is customer count multiplied by annual spend.
Inquoria scores each segment as growth plus margin minus risk and selects the highest score.
It compares each source with the exact target year, region, and metric and lists mismatches.
It multiplies the supplied non-negative sizing inputs without extrapolation and returns their source IDs.
A sourced market research baseline
Two demo notes, no forecast, no cross-source validation
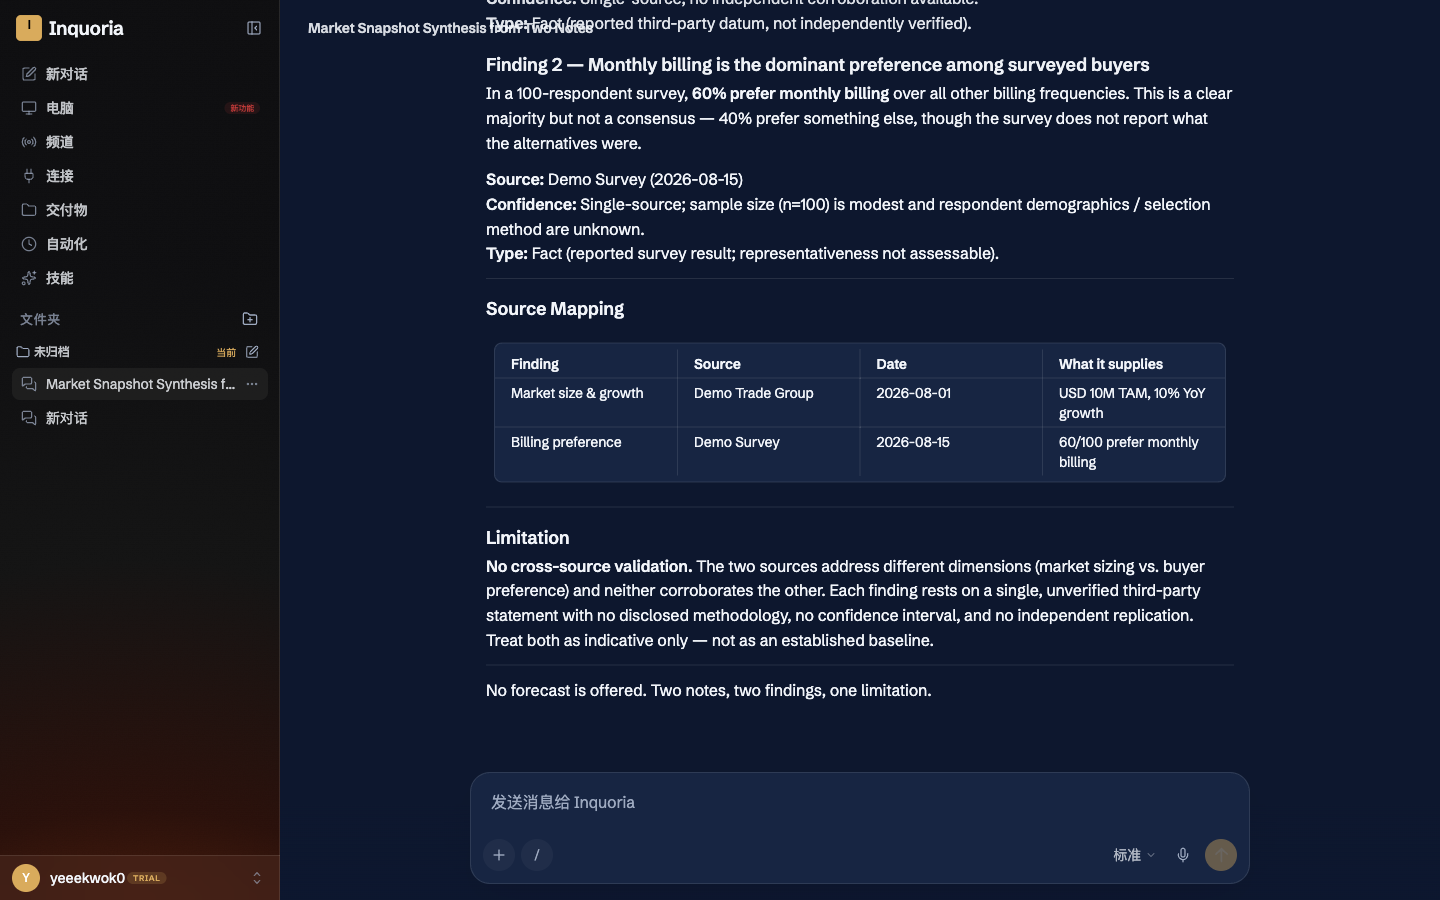
2026-08-01 · USD 10M TAM · 10% YoY
2026-08-15 · 60 of 100 monthly · 40% counterweight
single-source labels on both findings · no forecast · sources do not corroborate
A scored segment is not a measured business outcome.
Three strict negative boundaries enforced by the Inquoria research runtime.
- 01
Collecting sources or deciding that a source is authoritative
- 02
Extrapolating beyond the supplied customer count and annual spend
- 03
Presenting the selected segment as a measured business outcome
Open a research workspace.
$19.00 is stated here before you register; card payment runs through Stripe Checkout inside the signed-in workspace.
$19.00 per month
Questions
How are segments scored?
Each supplied score is growth percentage plus margin percentage minus risk percentage. The highest resulting score is selected.
What makes a source mismatched?
A source is listed when its year, region, or metric differs from the target values supplied for the comparison.
How is market size calculated?
The engine multiplies the supplied customer count by supplied annual spend and returns both inputs together with the declared source IDs.
Does Inquoria gather or verify the sources?
No. This engine checks and retains source records you supply; it does not collect sources or establish their authority.